DAVID MUSILA
Governor
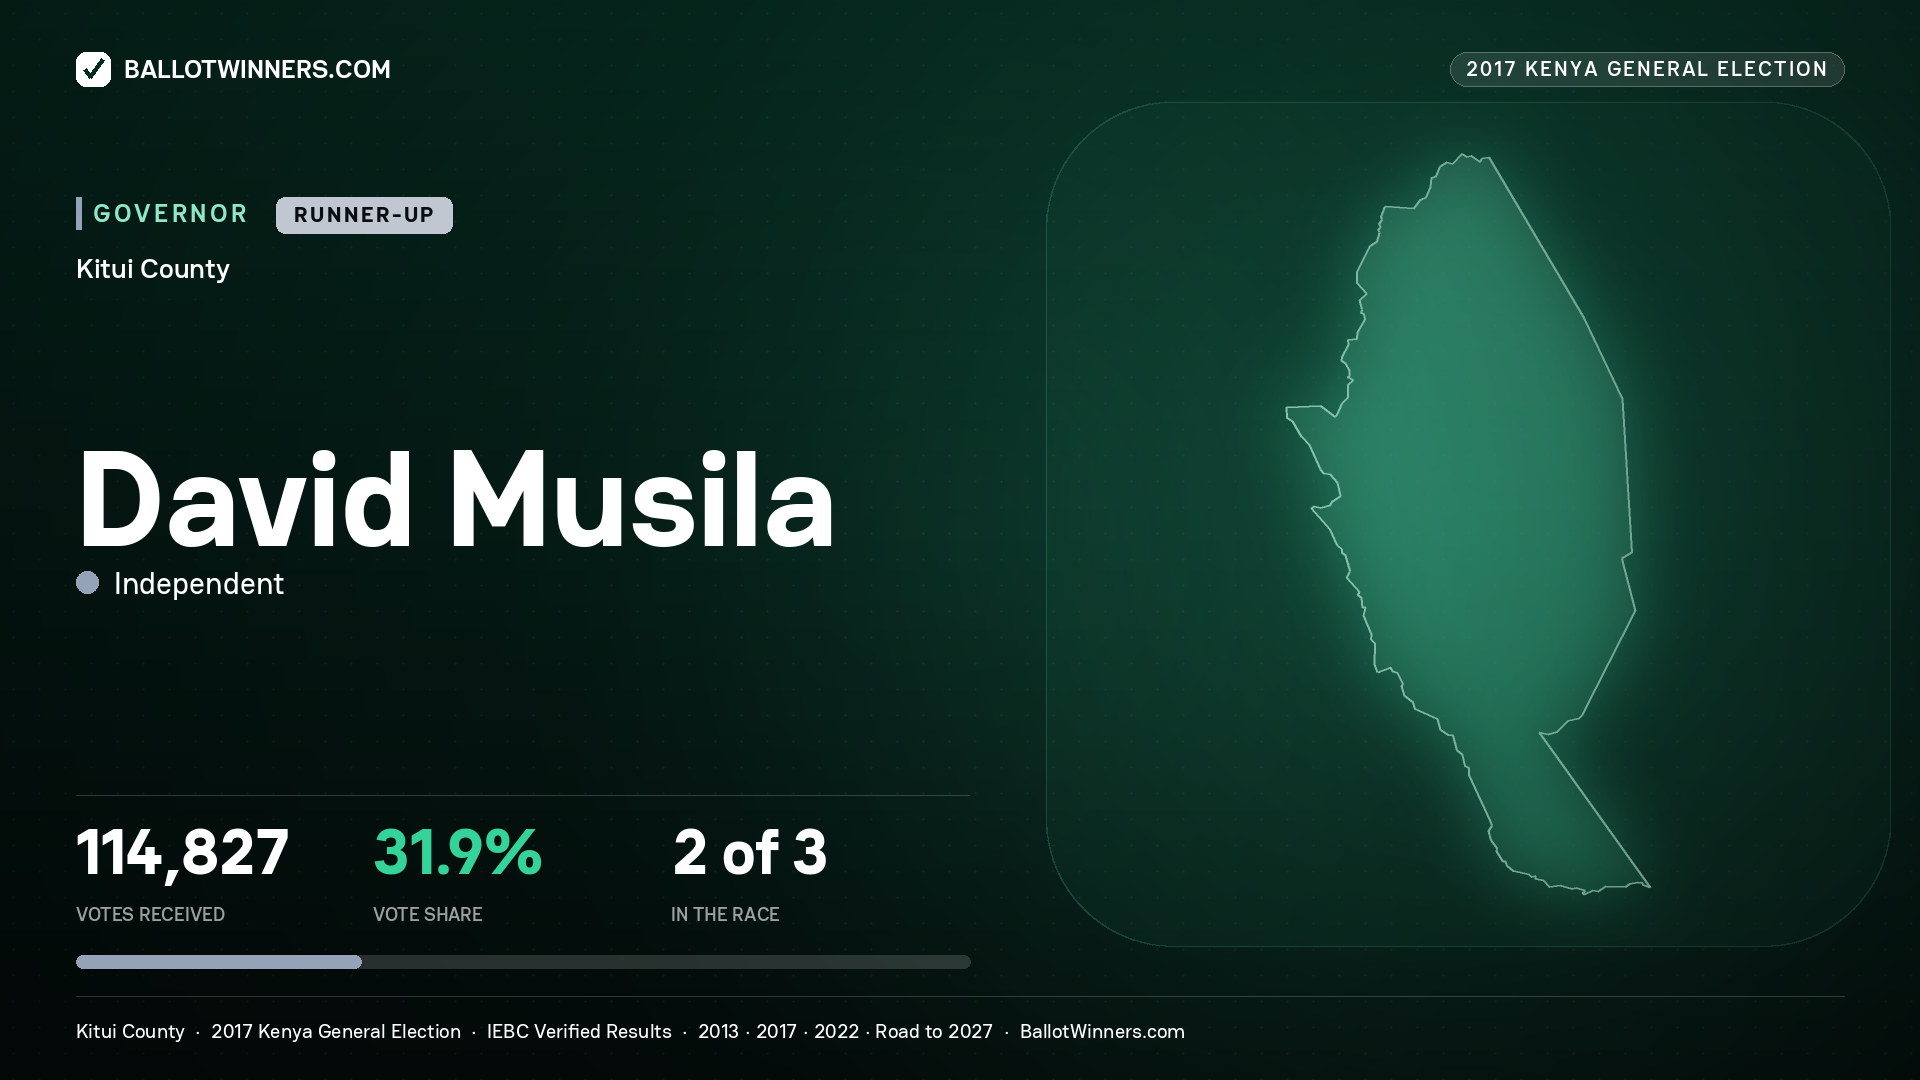
David Musila finished 2nd of 3 candidates in the 2017 Governor race in Kitui County, with 114,827 votes (31.94%), 55,163 behind the winner.
Election record
2 elections on record for this candidate.
| Year | Office | Votes | Result |
|---|---|---|---|
| 2022 | Governor | 117,606 | Contested |
| 2017 | Governor | 114,827 | Contested |
Is this you? Is something here wrong?
This page publishes the IEBC result for this seat. If your name, your party or
anything else on it is wrong, tell us and a person will check it. If you are
thinking about standing yourself, you can start here.
Position
2nd/3
In this race
Votes Received
114,827
Total votes for candidate
Total Votes Cast
359,498
In this election
Vote Share
31.94%
Of total votes
Vote Margin
-55,163 votes
Behind winner
Voter Turnout
67.5%
359,498 voted
Top 25 Stronghold Constituencies
00. Placeholder
00.00%
000,000 votes
00. Placeholder
00.00%
000,000 votes
00. Placeholder
00.00%
000,000 votes
00. Placeholder
00.00%
000,000 votes
00. Placeholder
00.00%
000,000 votes
00. Placeholder
00.00%
000,000 votes
Bottom 25 Constituencies
00. Placeholder
00.00%
000,000 votes
00. Placeholder
00.00%
000,000 votes
00. Placeholder
00.00%
000,000 votes
00. Placeholder
00.00%
000,000 votes
00. Placeholder
00.00%
000,000 votes
00. Placeholder
00.00%
000,000 votes
Population & Turnout — KITUI
1,136,187
Total population (2019 census)
532,758
Registered voters
359,498
Votes cast (67.5% turnout)
2017 Governor Race - All Candidates
| Rank | Candidate | Party | Votes | % | Distribution |
|---|---|---|---|---|---|
|
1
| NATIONAL RAINBOW COALITION | 169,990 | 47.29% |
|
|
|
2
|
DAVID MUSILA
YOU
| INDEPENDENT | 114,827 | 31.94% |
|
|
3
| WIPER DEMOCRATIC MOVEMENT- KENYA | 74,681 | 20.77% |
|
Total Candidates
3
Total Valid Votes
359,498