GRACE CHRISTINE NYAGA
Women Representative
Ran in 2013
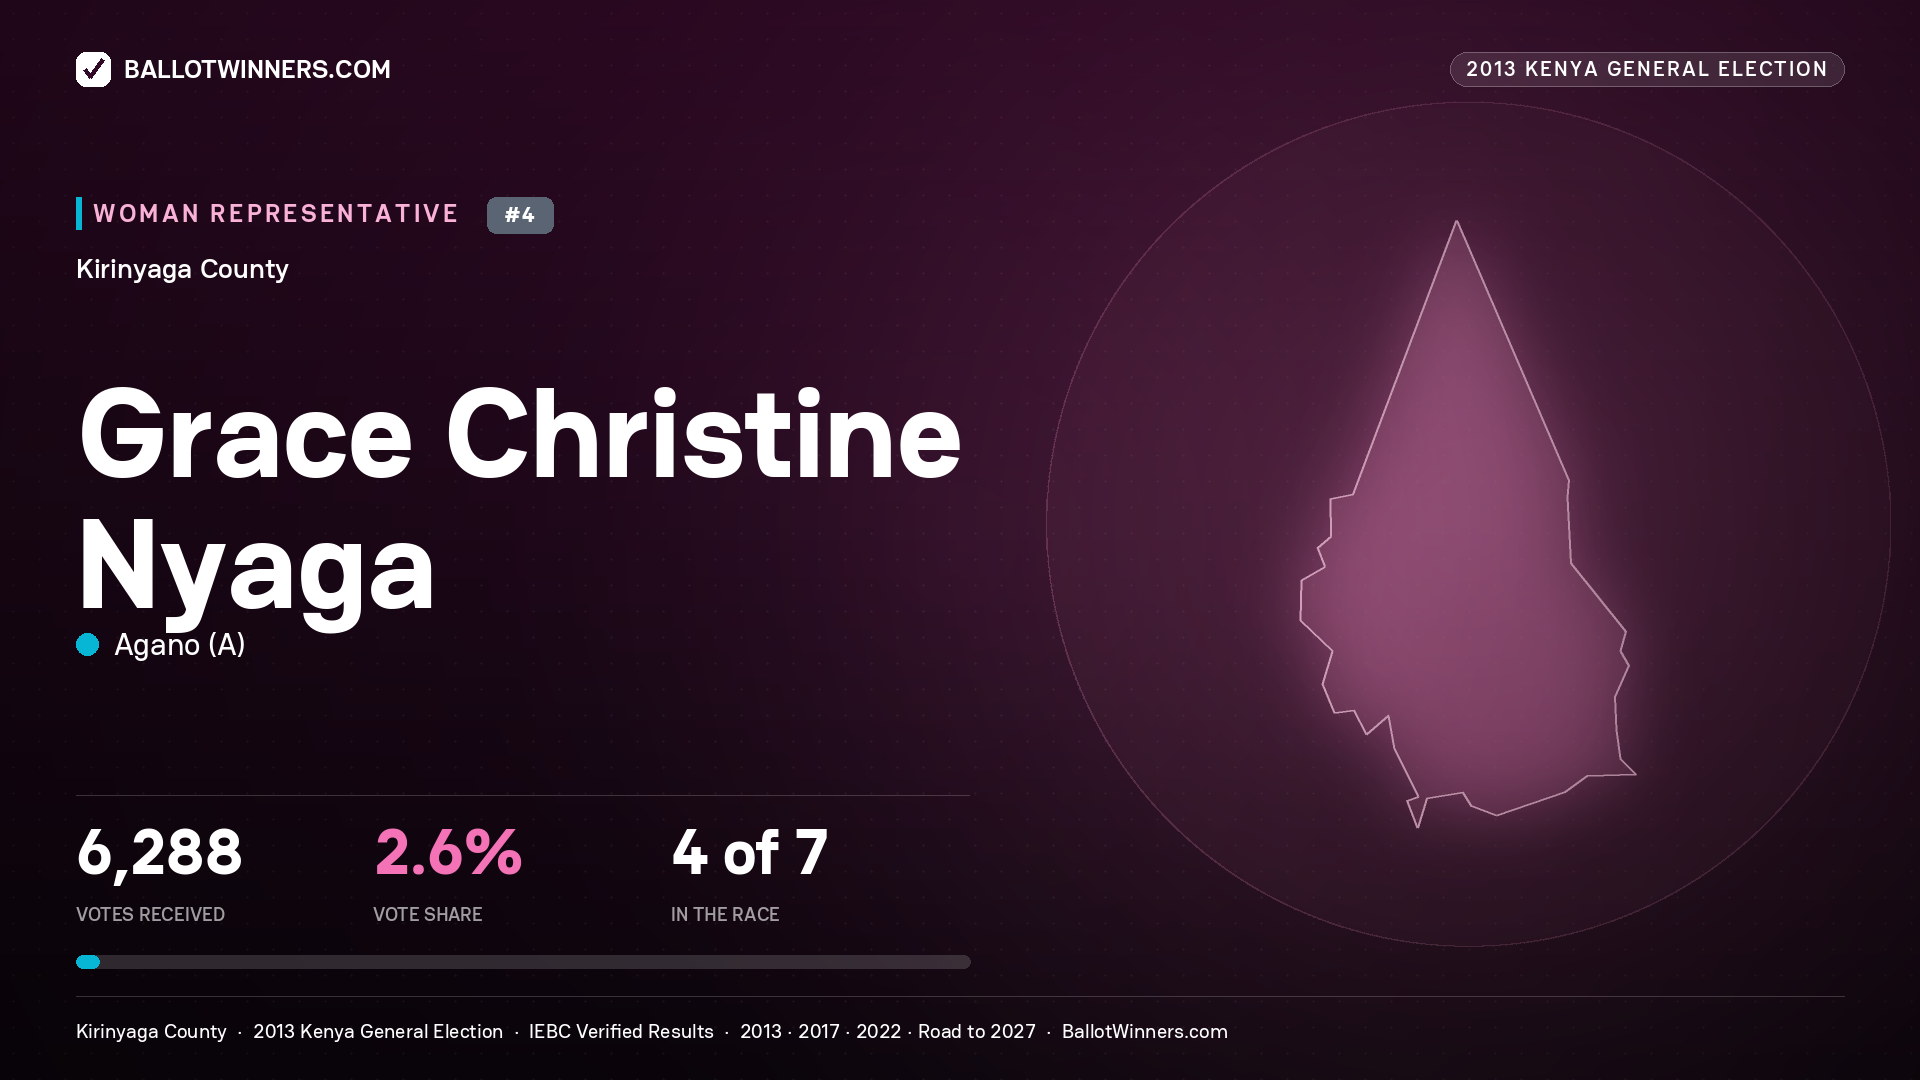
Grace Christine Nyaga finished 4th of 7 candidates in the 2013 Woman Rep race in Kirinyaga County, with 6,288 votes (2.63%), 153,881 behind the winner.
Is this you? Is something here wrong?
This page publishes the IEBC result for this seat. If your name, your party or
anything else on it is wrong, tell us and a person will check it. If you are
thinking about standing yourself, you can start here.
Position
4th/7
In this race
Votes Received
6,288
Total votes for candidate
Total Votes Cast
239,438
In this election
Vote Share
2.63%
Of total votes
Vote Margin
-153,881 votes
Behind winner
Voter Turnout
63.7%
239,438 voted
Top 25 Stronghold Constituencies
00. Placeholder
00.00%
000,000 votes
00. Placeholder
00.00%
000,000 votes
00. Placeholder
00.00%
000,000 votes
00. Placeholder
00.00%
000,000 votes
00. Placeholder
00.00%
000,000 votes
00. Placeholder
00.00%
000,000 votes
Bottom 25 Constituencies
00. Placeholder
00.00%
000,000 votes
00. Placeholder
00.00%
000,000 votes
00. Placeholder
00.00%
000,000 votes
00. Placeholder
00.00%
000,000 votes
00. Placeholder
00.00%
000,000 votes
00. Placeholder
00.00%
000,000 votes
Population & Turnout — KIRINYAGA
610,411
Total population (2019 census)
376,001
Registered voters
239,438
Votes cast (63.7% turnout)
2013 Women Representative Race - All Candidates
| Rank | Candidate | Party | Votes | % | Distribution |
|---|---|---|---|---|---|
|
1
| 160,169 | 66.89% |
|
||
|
2
| 48,279 | 20.16% |
|
||
|
3
| 14,755 | 6.16% |
|
||
|
4
| 6,288 | 2.63% |
|
||
|
5
| 4,877 | 2.04% |
|
||
|
6
| 3,253 | 1.36% |
|
||
|
7
| 1,817 | 0.76% |
|
Total Candidates
7
Total Valid Votes
239,438