KIAMA PETER MAINA
Member of County Assembly
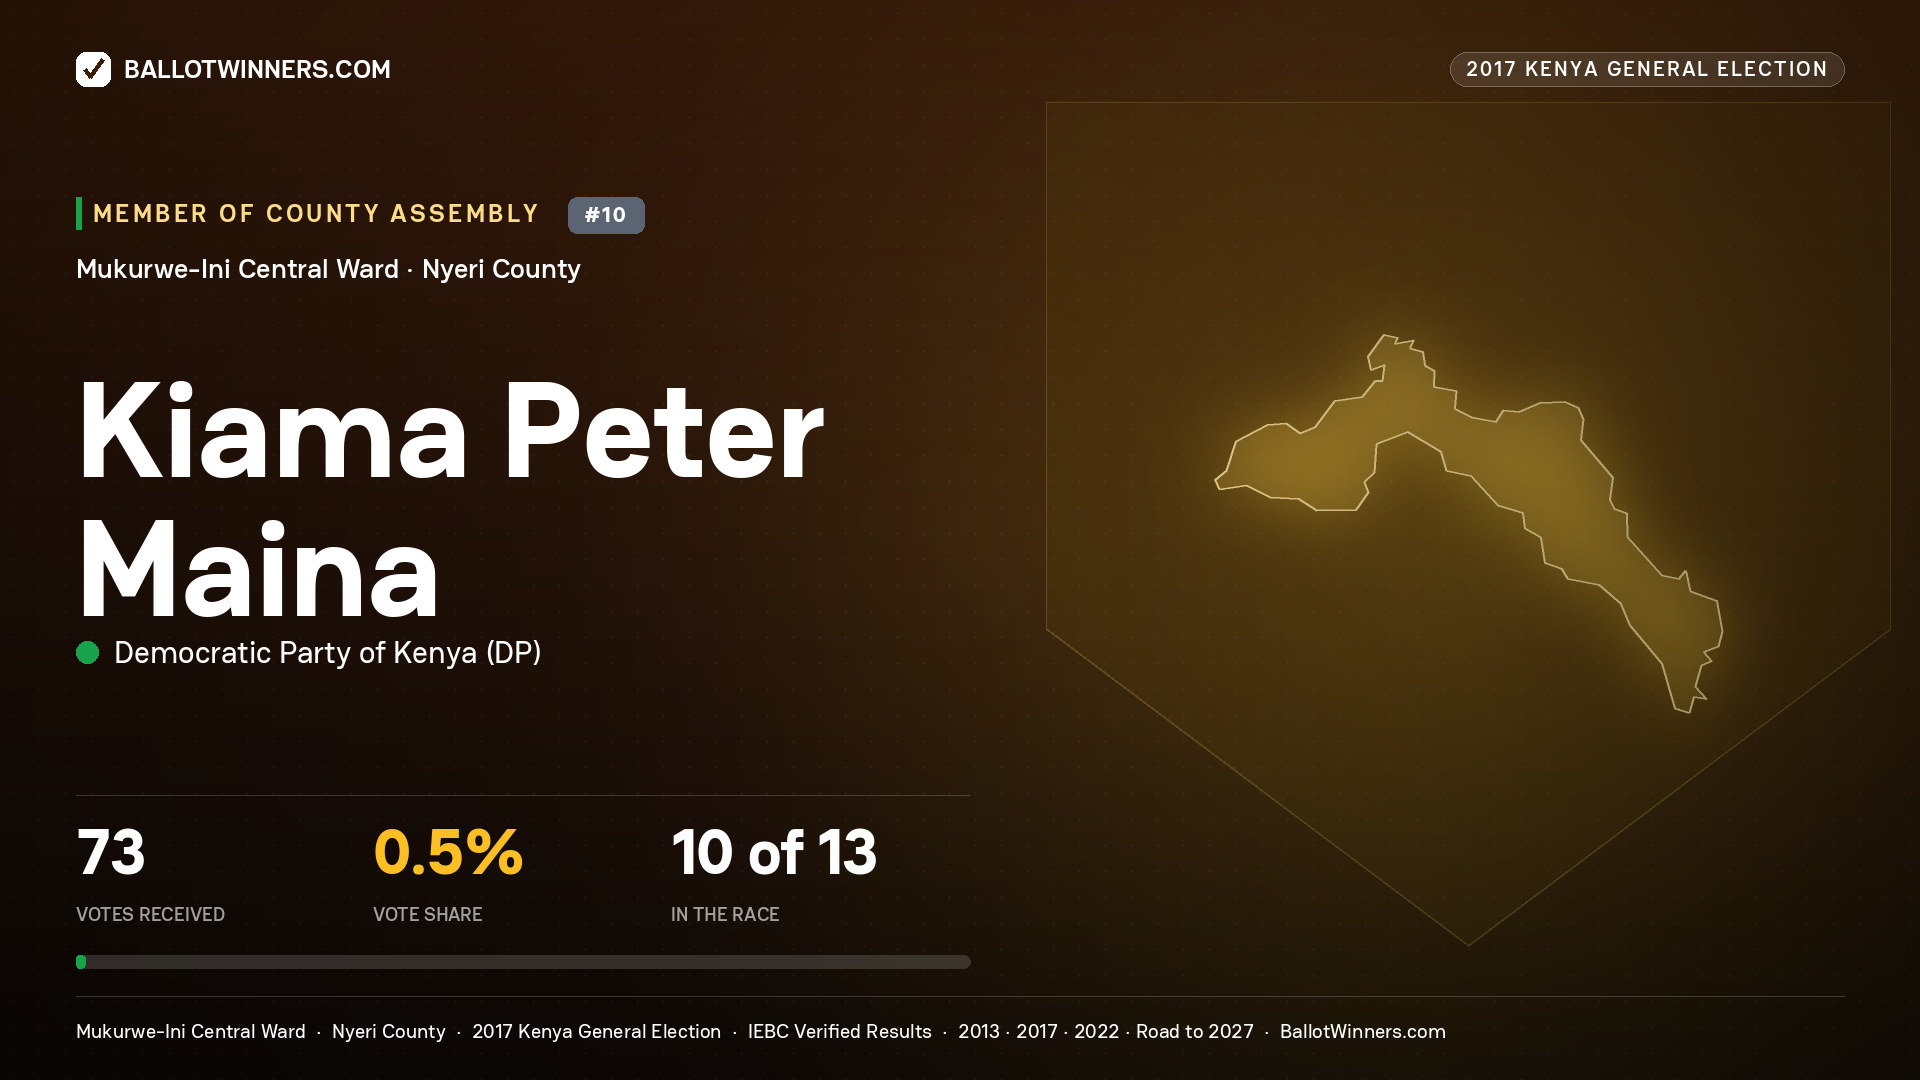
Kiama Peter Maina finished 10th of 13 candidates in the 2017 MCA race in Mukurwe-Ini Central Ward, with 73 votes (0.48%), 7,365 behind the winner.
Is this you? Is something here wrong?
This page publishes the IEBC result for this seat. If your name, your party or
anything else on it is wrong, tell us and a person will check it. If you are
thinking about standing yourself, you can start here.
Position
10th/13
In this race
Votes Received
73
Total votes for candidate
Total Votes Cast
15,211
In this election
Vote Share
0.48%
Of total votes
Vote Margin
-7,365 votes
Behind winner
Geographic Breakdown
MCA races are already at the smallest election unit this platform tracks (the ward itself), so there's no finer geographic breakdown available.
Population & Turnout — MUKURWE-INI CENTRAL
Census data hasn't been imported for MUKURWE-INI CENTRAL yet. Population and voter-registration figures will appear here automatically once it is.
15,211 votes were cast in this race.
2017 Member of County Assembly Race - All Candidates
| Rank | Candidate | Party | Votes | % | Distribution |
|---|---|---|---|---|---|
|
1
| JUBILEE PARTY | 7,438 | 48.90% |
|
|
|
2
| INDEPENDENT | 2,797 | 18.39% |
|
|
|
3
| NEW DEMOCRATS | 2,512 | 16.51% |
|
|
|
4
| INDEPENDENT | 694 | 4.56% |
|
|
|
5
| INDEPENDENT | 629 | 4.14% |
|
|
|
6
| INDEPENDENT | 349 | 2.29% |
|
|
|
7
| NATIONAL RAINBOW COALITION- KENYA | 231 | 1.52% |
|
|
|
8
| PARTY OF NATIONAL UNITY | 174 | 1.14% |
|
|
|
9
| INDEPENDENT | 174 | 1.14% |
|
|
|
10
| DEMOCRATIC PARTY OF KENYA | 73 | 0.48% |
|
|
|
11
| MAENDELEO CHAP CHAP PARTY | 55 | 0.36% |
|
|
|
12
| SAFINA | 51 | 0.34% |
|
|
|
13
| INDEPENDENT | 34 | 0.22% |
|
Total Candidates
13
Total Valid Votes
15,211