MUTHAMA MUTINDA MICHAEL
Member of County Assembly
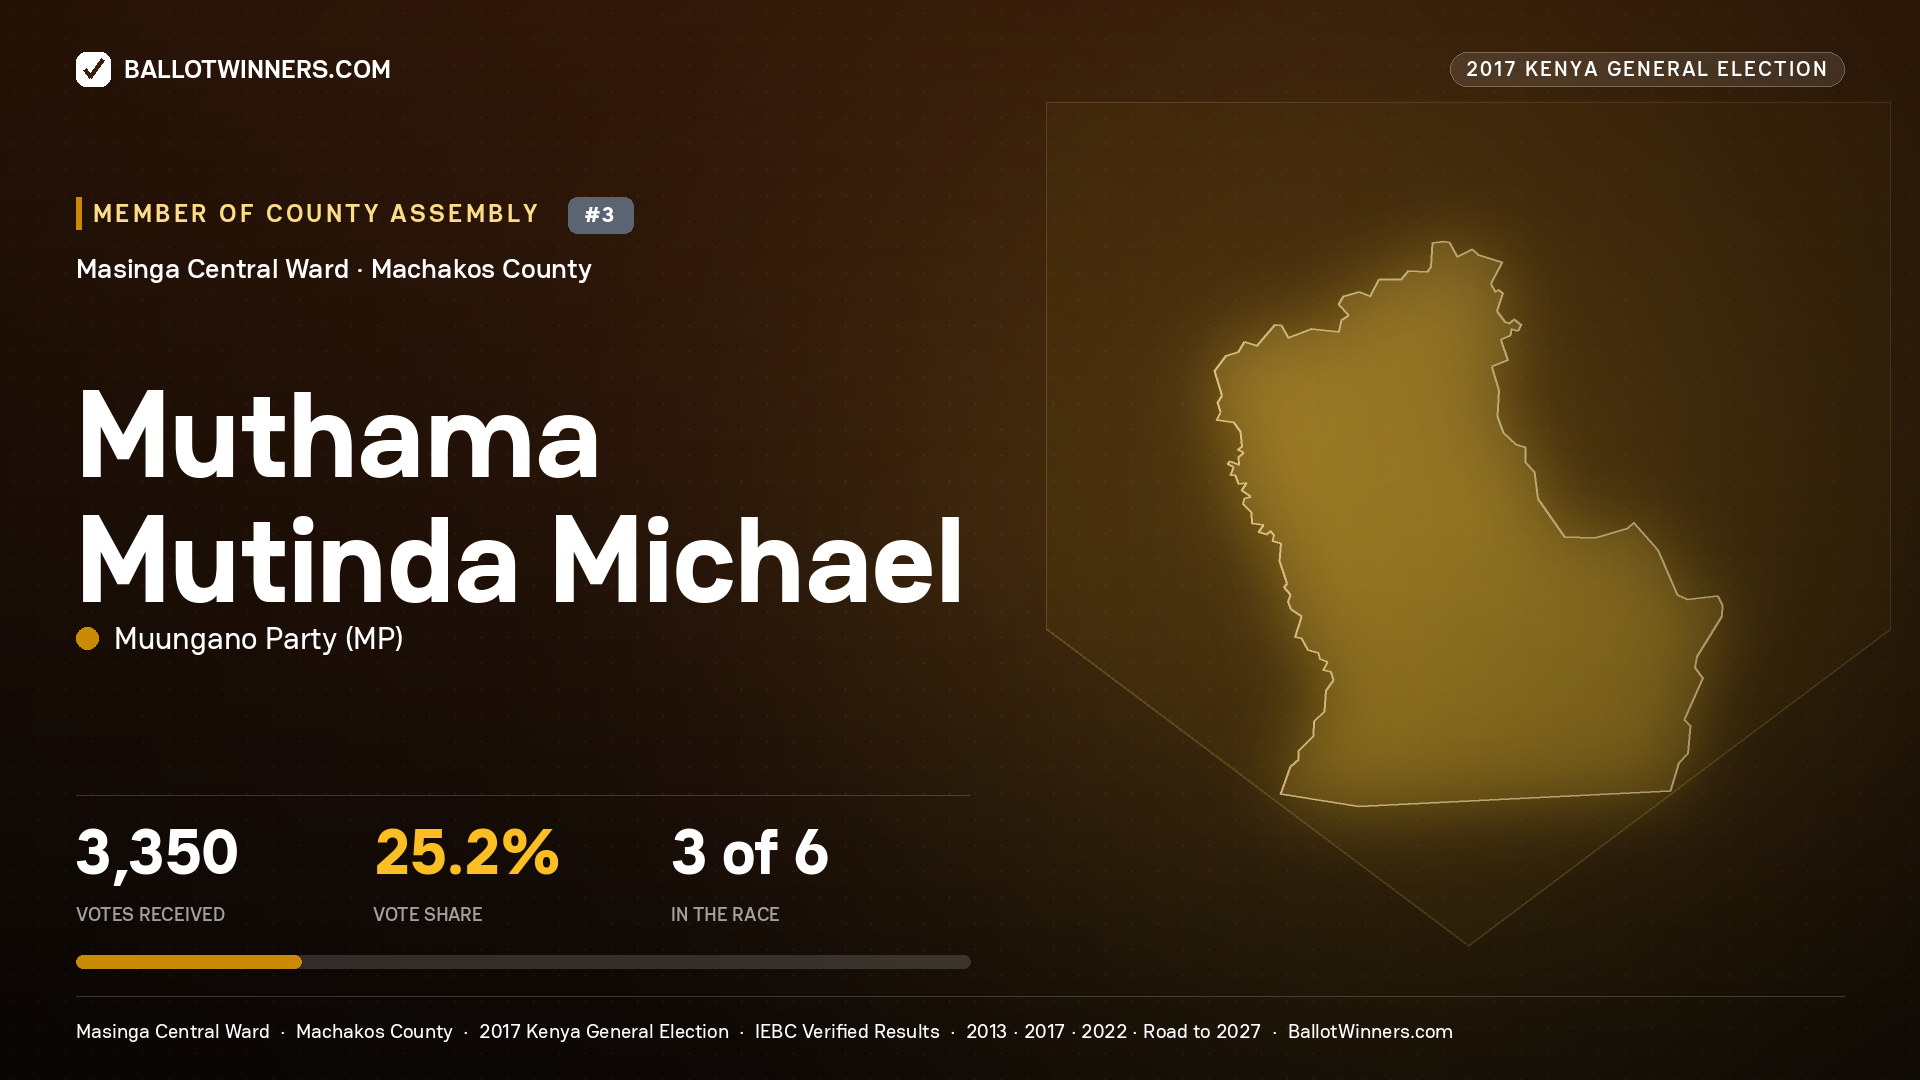
Muthama Mutinda Michael finished 3rd of 6 candidates in the 2017 MCA race in Masinga Central Ward, with 3,350 votes (25.16%), 1,916 behind the winner.
Election record
2 elections on record for this candidate.
| Year | Office | Votes | Result |
|---|---|---|---|
| 2017 | MCA | 3,350 | Contested |
| 2013 | MCA | 1,352 | Contested |
Is this you? Is something here wrong?
This page publishes the IEBC result for this seat. If your name, your party or
anything else on it is wrong, tell us and a person will check it. If you are
thinking about standing yourself, you can start here.
Position
3rd/6
In this race
Votes Received
3,350
Total votes for candidate
Total Votes Cast
13,313
In this election
Vote Share
25.16%
Of total votes
Vote Margin
-1,916 votes
Behind winner
Geographic Breakdown
MCA races are already at the smallest election unit this platform tracks (the ward itself), so there's no finer geographic breakdown available.
Population & Turnout — MASINGA CENTRAL
Census data hasn't been imported for MASINGA CENTRAL yet. Population and voter-registration figures will appear here automatically once it is.
13,313 votes were cast in this race.
2017 Member of County Assembly Race - All Candidates
| Rank | Candidate | Party | Votes | % | Distribution |
|---|---|---|---|---|---|
|
1
| WIPER DEMOCRATIC MOVEMENT- KENYA | 5,266 | 39.56% |
|
|
|
2
| MAENDELEO CHAP CHAP PARTY | 3,730 | 28.02% |
|
|
|
3
| MUUNGANO PARTY | 3,350 | 25.16% |
|
|
|
4
| PEOPLES TRUST PARTY | 787 | 5.91% |
|
|
|
5
| JUBILEE PARTY | 143 | 1.07% |
|
|
|
6
| INDEPENDENT | 37 | 0.28% |
|
Total Candidates
6
Total Valid Votes
13,313