
PETER GATIRAU MUNYA
Governor
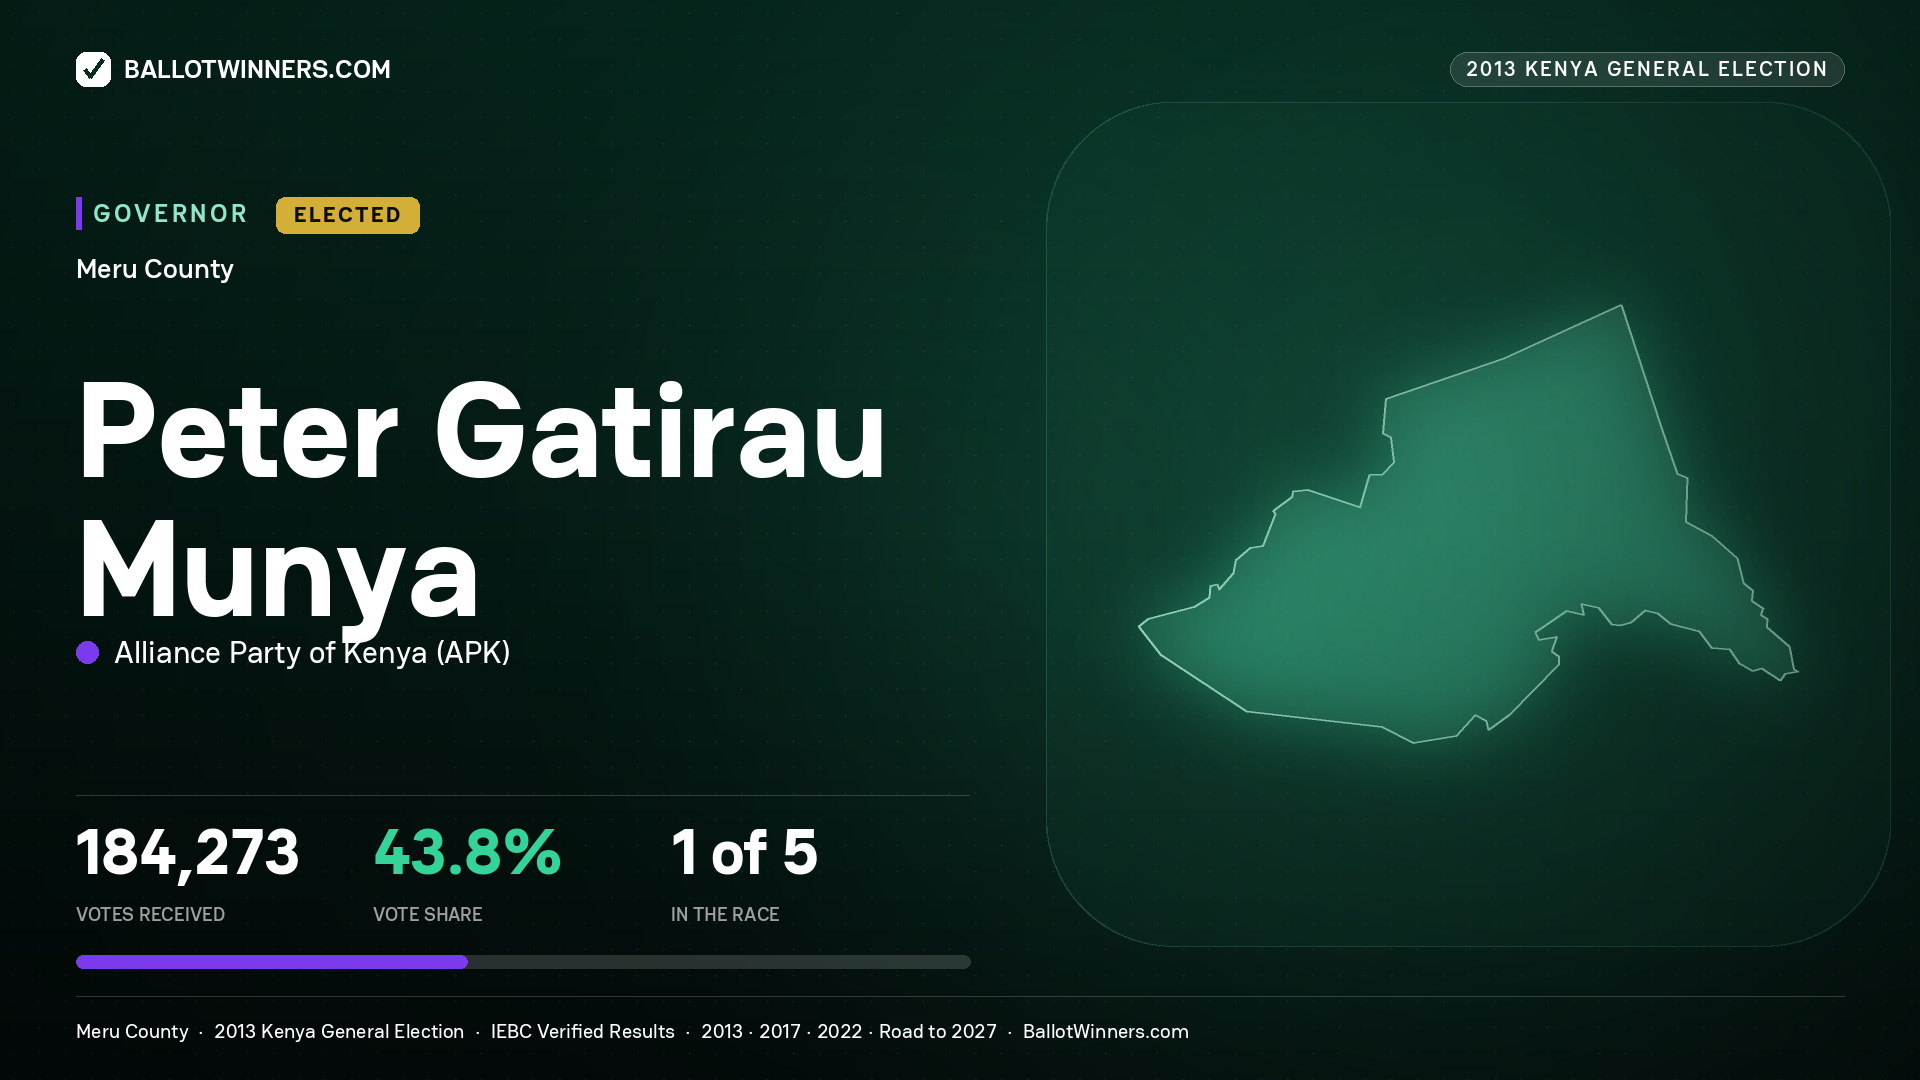
Peter Gatirau Munya won the 2013 Governor race in Meru County against 4 other candidates, with 184,273 votes (43.82%), 4,000 ahead of the runner-up.
Election record
2 elections on record for this candidate.
| Year | Office | Votes | Result |
|---|---|---|---|
| 2017 | Governor | 231,420 | Contested |
| 2013 | Governor | 184,273 | Elected |
Is this you? Is something here wrong?
This page publishes the IEBC result for this seat. If your name, your party or
anything else on it is wrong, tell us and a person will check it. If you are
thinking about standing yourself, you can start here.
Position
1st/5
In this race
Votes Received
184,273
Total votes for candidate
Total Votes Cast
420,520
In this election
Vote Share
43.82%
Of total votes
Vote Margin
+4,000 votes
Ahead of 2nd place
Voter Turnout
54.5%
420,520 voted
Top 25 Stronghold Constituencies
00. Placeholder
00.00%
000,000 votes
00. Placeholder
00.00%
000,000 votes
00. Placeholder
00.00%
000,000 votes
00. Placeholder
00.00%
000,000 votes
00. Placeholder
00.00%
000,000 votes
00. Placeholder
00.00%
000,000 votes
Bottom 25 Constituencies
00. Placeholder
00.00%
000,000 votes
00. Placeholder
00.00%
000,000 votes
00. Placeholder
00.00%
000,000 votes
00. Placeholder
00.00%
000,000 votes
00. Placeholder
00.00%
000,000 votes
00. Placeholder
00.00%
000,000 votes
Population & Turnout — MERU
1,545,714
Total population (2019 census)
772,139
Registered voters
420,520
Votes cast (54.5% turnout)
2013 Governor Race - All Candidates
| Rank | Candidate | Party | Votes | % | Distribution |
|---|---|---|---|---|---|
|
1
| ALLIANCE PARTY OF KENYA | 184,273 | 43.82% |
|
|
|
2
| THE NATIONAL ALLIANCE | 180,273 | 42.87% |
|
|
|
3
| KENYA NATIONAL CONGRESS | 34,340 | 8.17% |
|
|
|
4
| UNITED DEMOCRATIC FORUM PARTY | 12,134 | 2.89% |
|
|
|
5
| ORANGE DEMOCRATIC MOVEMENT | 9,500 | 2.26% |
|
Total Candidates
5
Total Valid Votes
420,520