Kenya's 2013 Presidential Election Results by County
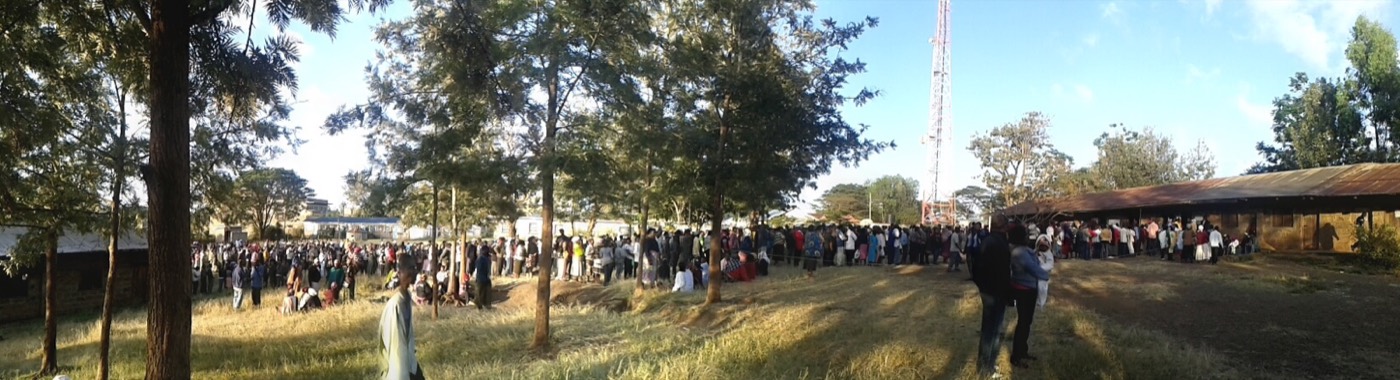
Uhuru Kenyatta won Kenya's presidential election of 4 March 2013 with 6,173,433 votes, 50.51 per cent of valid votes, against 5,340,546 votes, 43.70 per cent, for Raila Odinga. It was the first election under the 2010 Constitution, and Kenyatta cleared the 50 per cent line with 62,906 votes to spare, which is all that stood between him and a run-off. Odinga won 26 counties, Kenyatta 20, and Musalia Mudavadi one, Vihiga. The Supreme Court upheld the result on 30 March 2013.
The national result
| Candidate | Coalition | Votes | Share of valid votes |
|---|---|---|---|
| Uhuru Kenyatta | Jubilee Alliance | 6,173,433 | 50.51% |
| Raila Odinga | Coalition for Reforms and Democracy (CORD) | 5,340,546 | 43.70% |
| Musalia Mudavadi | Amani Coalition | 483,981 | 3.96% |
| Peter Kenneth | Eagle Alliance | 72,786 | 0.60% |
| Mohammed Abduba Dida | Alliance for Real Change | 52,848 | 0.43% |
| Martha Karua | NARC-Kenya | 43,881 | 0.36% |
| James ole Kiyiapi | Restore and Build Kenya | 40,998 | 0.34% |
| Paul Muite | Safina | 12,580 | 0.10% |
The eight candidates received 12,221,053 valid votes between them, and 108,975 ballots were rejected. The register held 14,388,781 voters and turnout was 85.91 per cent, the figures reported for the election. The running mates were William Ruto for Kenyatta and Kalonzo Musyoka for Odinga.
Half of the valid vote was 6,110,527. Kenyatta's 6,173,433 was above that by 62,906, about half of one per cent of the votes cast. Under the new Constitution he also needed at least 25 per cent in 24 counties, which he passed comfortably.
County by county, 4 March 2013
The table gives the IEBC's official county results for the two leading candidates, as compiled in the Elections Observation Group (ELOG) results database. Percentages are each candidate's share of the valid votes cast for all eight candidates in that county, calculated from ELOG's figures and rounded to two decimal places, so in the Western counties where Mudavadi did well the two shares add up to much less than 100.
| # | County | Registered voters | Kenyatta | % | Odinga | % |
|---|---|---|---|---|---|---|
| 1 | Mombasa | 408,747 | 64,793 | 24.06 | 189,985 | 70.54 |
| 2 | Kwale | 174,443 | 17,633 | 14.15 | 101,407 | 81.37 |
| 3 | Kilifi | 336,132 | 23,386 | 10.84 | 182,708 | 84.67 |
| 4 | Tana River | 79,454 | 22,419 | 34.99 | 39,666 | 61.90 |
| 5 | Lamu | 52,346 | 17,677 | 40.61 | 22,962 | 52.74 |
| 6 | Taita Taveta | 113,862 | 12,175 | 13.33 | 75,329 | 82.48 |
| 7 | Garissa | 115,202 | 41,672 | 45.60 | 44,724 | 48.94 |
| 8 | Wajir | 118,091 | 38,927 | 39.05 | 49,712 | 49.86 |
| 9 | Mandera | 120,768 | 94,433 | 93.25 | 4,366 | 4.31 |
| 10 | Marsabit | 104,615 | 42,406 | 47.35 | 43,843 | 48.95 |
| 11 | Isiolo | 54,462 | 26,401 | 55.75 | 14,108 | 29.79 |
| 12 | Meru | 487,265 | 384,290 | 90.34 | 32,447 | 7.63 |
| 13 | Tharaka-Nithi | 155,487 | 128,397 | 93.08 | 7,120 | 5.16 |
| 14 | Embu | 227,286 | 177,676 | 89.77 | 15,912 | 8.04 |
| 15 | Kitui | 324,673 | 40,752 | 14.90 | 219,588 | 80.30 |
| 16 | Machakos | 445,096 | 35,660 | 9.71 | 319,594 | 87.03 |
| 17 | Makueni | 298,221 | 12,652 | 5.06 | 228,843 | 91.52 |
| 18 | Nyandarua | 255,984 | 232,808 | 97.83 | 2,889 | 1.21 |
| 19 | Nyeri | 356,380 | 318,880 | 97.05 | 5,638 | 1.72 |
| 20 | Kirinyaga | 265,290 | 231,868 | 96.66 | 3,471 | 1.45 |
| 21 | Murang'a | 452,841 | 406,334 | 96.45 | 10,312 | 2.45 |
| 22 | Kiambu | 861,828 | 705,185 | 90.80 | 61,700 | 7.94 |
| 23 | Turkana | 132,885 | 30,235 | 29.97 | 68,402 | 67.81 |
| 24 | West Pokot | 120,986 | 79,772 | 73.82 | 24,962 | 23.10 |
| 25 | Samburu | 61,114 | 22,085 | 41.07 | 31,086 | 57.81 |
| 26 | Trans Nzoia | 244,640 | 74,466 | 38.13 | 92,035 | 47.13 |
| 27 | Uasin Gishu | 330,618 | 211,438 | 75.01 | 60,060 | 21.31 |
| 28 | Elgeyo-Marakwet | 134,568 | 113,680 | 92.84 | 5,993 | 4.89 |
| 29 | Nandi | 263,254 | 192,587 | 82.30 | 20,549 | 8.78 |
| 30 | Baringo | 173,653 | 138,488 | 88.58 | 14,824 | 9.48 |
| 31 | Laikipia | 173,905 | 134,111 | 85.93 | 19,702 | 12.62 |
| 32 | Nakuru | 695,319 | 494,239 | 80.92 | 105,660 | 17.30 |
| 33 | Narok | 262,739 | 109,413 | 46.71 | 118,623 | 50.64 |
| 34 | Kajiado | 304,346 | 138,851 | 52.77 | 117,856 | 44.79 |
| 35 | Kericho | 290,458 | 238,556 | 91.41 | 17,326 | 6.64 |
| 36 | Bomet | 252,358 | 210,501 | 93.26 | 10,463 | 4.64 |
| 37 | Kakamega | 567,460 | 12,469 | 2.67 | 303,120 | 64.80 |
| 38 | Vihiga | 202,822 | 2,542 | 1.54 | 77,825 | 47.03 |
| 39 | Bungoma | 410,462 | 42,988 | 12.44 | 185,419 | 53.64 |
| 40 | Busia | 251,305 | 8,186 | 3.74 | 189,161 | 86.51 |
| 41 | Siaya | 311,919 | 884 | 0.31 | 284,031 | 99.06 |
| 42 | Kisumu | 385,820 | 4,630 | 1.33 | 337,232 | 97.15 |
| 43 | Homa Bay | 325,826 | 725 | 0.24 | 303,447 | 99.27 |
| 44 | Migori | 283,862 | 26,055 | 10.03 | 225,645 | 86.82 |
| 45 | Kisii | 412,945 | 95,596 | 27.78 | 236,831 | 68.83 |
| 46 | Nyamira | 219,358 | 54,071 | 29.84 | 121,590 | 67.09 |
| 47 | Nairobi City | 1,728,801 | 659,490 | 47.16 | 691,156 | 49.42 |
The 47 county rows add up to 6,172,482 for Kenyatta and 5,339,322 for Odinga. The other 951 and 1,224 votes in the national totals were cast outside the county rows, in the diaspora and in prisons.
Who won where
Kenyatta's votes came from Mount Kenya and the Rift Valley, the two blocs joined by his alliance with William Ruto. Nyandarua gave him 97.83 per cent, Nyeri 97.05 and Kirinyaga 96.66. Kiambu, with 705,185 votes, was his biggest county, followed by Nairobi (659,490) and Nakuru (494,239). In the Rift, Bomet (93.26 per cent), Elgeyo-Marakwet (92.84) and Kericho (91.41) were his strongest. He also won Mandera with 93.25 per cent.
Odinga carried Nyanza, the Coast and Ukambani, the home region of his running mate Kalonzo Musyoka, where Makueni gave him 91.52 per cent and Machakos 87.03. His best counties were Homa Bay (99.27 per cent), Siaya (99.06) and Kisumu (97.15). Nairobi went to him narrowly, 691,156 to 659,490.
Western was split three ways. Mudavadi, whose political base is in the region, won Vihiga with 82,426 votes against Odinga's 77,825, and took 31 per cent in both Kakamega and Bungoma. Odinga still won those two counties, with 64.80 and 53.64 per cent.
The closest counties
| County | Winner | Margin in votes |
|---|---|---|
| Marsabit | Odinga | 1,437 |
| Garissa | Odinga | 3,052 |
| Lamu | Odinga | 5,285 |
| Samburu | Odinga | 9,001 |
| Narok | Odinga | 9,210 |
| Wajir | Odinga | 10,785 |
| Isiolo | Kenyatta | 12,293 |
| Tana River | Odinga | 17,247 |
Kenyatta's share was 25 per cent or more in 32 counties, and Odinga's in 29. Turnout was highest in Homa Bay (94.14 per cent on ELOG's figures), Nyandarua and Murang'a, and lowest in Kilifi (64.91) and Mombasa (66.62).
The Supreme Court case
The Coalition for Reforms and Democracy, led by Odinga, petitioned the Supreme Court on 10 March 2013, and the Africa Centre for Open Governance (AfriCOG) filed a separate petition. On 30 March 2013 Chief Justice Willy Mutunga read the court's unanimous judgment: Kenyatta and Ruto had been validly elected, and the irregularities found did not affect the outcome. Kenyatta was sworn in on 9 April 2013.
Four years later the same court annulled Kenyatta's re-election, the story told in the 2017 results by county. The 2022 figures are in the 2022 results by county, and the county registers for all three elections are in registered voters by county.
The broad regional pattern of 2013 held through 2017 and 2022, with Mount Kenya and most of the Rift Valley on one side and Nyanza, the Coast and Ukambani on the other. Odinga died on 15 October 2025. The next presidential election is on 10 August 2027.
Frequently Asked Questions
Who won the 2013 presidential election in Kenya?
Uhuru Kenyatta, with 6,173,433 votes (50.51 per cent) against 5,340,546 (43.70 per cent) for Raila Odinga. The election was held on 4 March 2013 and the Supreme Court upheld the result on 30 March 2013.
How many counties did Uhuru win in 2013?
Uhuru Kenyatta won 20 counties, Raila Odinga 26 and Musalia Mudavadi one, Vihiga, according to the IEBC's county results.
Did the 2013 election nearly go to a run-off?
Yes. Kenyatta's 6,173,433 votes were 62,906 more than half of the 12,221,053 valid votes. Below 50 per cent, the Constitution would have required a run-off between the top two.
What was the turnout in Kenya's 2013 election?
About 85.9 per cent of the 14.4 million registered voters. Homa Bay recorded the highest county turnout, 94.14 per cent.